Measurement of Cuffless Blood Pressure by Using a Magnetoplethysmogram Pulsimeter
Lee WH, Rho YH, Hyeon SS, Song JB and Lee SS*
DOI10.21767/2471-9897.1000012
Lee WH1, Rho YH2, Hyeon SS3, Song JB4 and Lee SS4*
1Department of Physics, Penn State University, University Park, Pennsylvania, USA
2HANMAUM Clinic, Dearimdong Youngdeungpogu, Seoul, Korea
3IRUMEDI (Ltd.), Ilsandonggu, Koyang, Korea
4Department of Oriental Biomedical Engineering, Sangji University, Wonju, Korea
- *Corresponding Author:
- Lee SS
Professor in Oriental Biomedical Engineering
Sangji University, Wonju 26339, Korea
Tel: 83-337300415
E-mail: sslee@sangji.ac.kr
Received date: August 17, 2016; Accepted date: September 13, 2016; Published date: December 06, 2016
Citation: Lee WH, Rho YH, Hyeon SS, et al. Measurement of Cuffless Blood Pressure by Using a Magnetoplethysmogram Pulsimeter. 2016. 2:2. doi: 10.21767/2471-9897.1000012
Copyright: © 2016 Lee WH, et al. This is an open-access article distributed under the terms of the Creative Commons Attribution License, which permits unrestricted use, distribution, and reproduction in any medium, provided the original author and source are credited.
Abstract
A wearable wrist magnetoplethysmogram (MPG) pulsimeter was developed for blood pressure (BP) monitoring using a magnetic field-sensing semiconductor Hall device. The pulsimeter contains a permanent magnet attached to silicon housing at the centre of a radial artery. BP and pulse rate were measured without using a cuff, utilizing an MPG pulsimeter consisting of a small and portable apparatus containing the measurement system with hardware and software for transforming the measured radial artery pulse waves into voltage signals. To acquire precise BP, the signals generated by the MPG pulsimeter were simultaneously compared with systole and diastole areas in the radial artery pulse wave. The pulse wave data for three clinical participants (normal BP, hypotension, and hypertension) were analysed. Analysis of pulse waves measured during testing of the arterial pulsimeter was conducted using two BP equations. The BP values calculated from these equations for the radial artery pulse wave data acquired during a 5-s-long window by using the MPG pulsimeter were compared to the BP values measured using electronic or liquid mercury BP meters. Our results are likely to be useful for developing a biomedical signal storage device for mobile U-healthcare applications.
Keywords
Central artery pressure; Blood pressure; Radial artery pulse wave; Magnetoplethysmogram
Introduction
The brain’s vasculature relies on the central aorta, and there is a direct correlation between atherosclerosis of the central aorta and that of the neurovascular system [1,2]. This relation between the brain’s vascular system and the central aorta has been evaluated recently in terms of the central arterial pressure (CAP) and the compliance of aorta. In the United States, there are 50 million hypertension patients, and 3 million patients exhibit normal self-adjustment, making them similar to patients with normal blood pressure (BP). The remaining patients exhibit malfunctioning self-adjustment [3,4]. Clinical trials suggest that patients with high-resistance hypertension are more likely to develop cerebral thrombosiscompared to patients with normal-resistance hypertension, when both groups are treated to the same extent by using anti-hypertension medication [5,6].
As a rule, BP is measured during the systolic and diastolic cycles. BP can be measured at several points during the systolic and diastolic cycles [7]. The systolic pressure can be measured after the Korotkoff sound is first detected, while the diastolic pressure can be measured after the sound is no longer detected. The systolic pressure occurs when a ventricle is contracted, and it is pumping blood out of the heart. The diastolic pressure occurs when a ventricle is relaxed, and is being refilled with blood. The blood flow ceases when a blood vessel is pressurized [8]. As the pressure decreases, blood will start to flow again and sound can be detected. The pressure at which this occurs is called the systolic pressure. At some point, the sound is no longer detected as the pressure decreases further. The pressure at this point is called the diastolic pressure. The blood pressure is reported in the units of millimeters mercury (mmHg).
The CAP is calculated as a peak height of a pressure waveform that is formed when the forward and reflected waves in the central aorta combine [1-3]. For the central aorta, the CAP during the systolic stage cannot be measured using a general-type BP device monitoring the upper brachial artery. The pulse wave travels along the wall of the artery, and the amplitude of the wave is partially reduced as it passes a branching point. A fraction of the pulse wave, called the forward wave, is transmitted and continues to propagate along the wall. A complementary fraction, called the reflected wave, is reflected and propagates backward [4-6].
Thus, on top of the baseline pressure, the central aorta experiences additional pressure when the forward and reflected waves superpose. The pressure owing to the central arterial pulse wave depends on the heart contractibility, the extent of a blood vessel’s stiffness, peripheral revascularization, and the stiffness and function of peripheral blood vessels [9]. The central aorta is frequently subject not only to arteriosclerosis but also to atherosclerosis; thus an increase in the CAP can aggravate atherosclerosis. The causes underlying a gradually increasing CAP include abnormal acceleration of aging, hypertension, hyperlipidemia, and diabetes [3-5]. These are classified as diseases that are very likely to induce arterial stiffness and yield malfunctioning blood vessels.
In the present work, we developed a magnetoplethysmogram (MPG) pulsimeter that utilizes a magnetic field-sensing semiconductor Hall device for acquiring precise BP [10-12]. We sought to develop a wrist-wearable MPG pulsimeter for accurately measuring both the BP and pulse rate of a moving subject [13,14]. In addition, such a cuffless MPG pulsimeter can be incorporated into a wrist-wearable device for accurate measurements of BP and radial artery pulse [15].
Materials and Methods
Participants
The participants were recruited using the following typical three criteria: average people having normal BP; and average people having low BP, which was defined as below 110 mmHg and 70 mmHg of systolic and diastolic pressure, respectively; average people having hypertension; The participants chosen for our research had to meet certain selection criteria. Applicants who were not excluded based on the exclusion criteria listed below, or who did not have a communication impediment, such as a reading or writing impediment, and who satisfied the following five criteria were chosen for inclusion in this study: (1) The candidate must be an adult volunteer aged between 20 years and 30 years who is not rejected based on the exclusion criteria. (2) The candidate must have a BP value measured by using electronic or mercury liquid BP meters. (3) The candidate had to be a volunteer who agreed to our clinical studies agreement. (4) The candidate had to be an individual whose condition could be determined by a clinical trial coordinator.
In this study, we excluded applicants who were not psychologically stable or who had an acute serious illness. We also excluded any person who had a chronic disease of the heart or any other diseases that might interfere with the interpretation of the results and the therapeutic effect. Applicants who had experienced clinical studies related to a pulsimeter within 1 month of our study were excluded, as were those who had diseases such as seizures or perception disorders, who wore cardiac pacemakers or who had implants with metal joints, prosthodontics, etc. All of these could affect the diagnosis made using the pulsimeter and make the clinical study difficult.
Experimental design
Periodic motion of an arterial vessel (such as the radial artery) induces variations in the vessel thickness and vessel distance from the skin surface. The pulse vessel periodicity is related to the electrocardiogram (ECG), and the blood flow velocity changes periodically [16]. The wearable medical device developed in this study consisted of a permanent magnet, Hall’s device, the measuring module, a light emitting diode (LED), a display panel, a USB port, and a switch. The permanent magnet had a diameter of 2 mm and its height was 1 mm, and the surface magnetic field generated by it was ~300 Oe [17-20]. The permanent magnet was installed at the center of a silicon rubber piece and glued using epoxy. The silicon rubber piece made a good contact with skin and applied uniform pressure on the radial artery.
The permanent magnet glued using epoxy at the center of the silicon rubber was positioned on the so-called “Chwan” point of the radial artery and the device enclosed the wrist by making contact with the skin surface, as shown in Figure 1a.

Figure 1: Photographs of (a) a mockup radial artery used for clinical testing and (b) a fully functioning wrist-wearable MPG pulsimeter. Schematic shows the cross-section with a detailed description of the device’s components.
A cylindrical permanent magnet in contact with the skin above the radial artery moved easily in response to the shock made by a pulse. For measuring the pulse wave in this experiment, the distance between the Hall device and the permanent magnet was in the 2.0-3.0 mm range. One permanent magnet in the measuring module moved by 1 mm up and down owing to the periodic motion of the radial artery vessel. The actual wrist-wearable device, featuring the measured radial artery waveforms, is shown in Figure 1b.
The electrical output signal of the pulse wave was acquired in self-examination measurements performed by the MPG pulsimeter equipped with the Hall device that automatically established a base point based on variations in the magnetic field intensity. Depending on the fluctuation of the permanent magnet, the acquired signals were filtered for eliminating noise. Pulse waveforms could be collected, analyzed, and transferred to a personal computer at a rate of 1000 points/s. After selecting one section, five repeating pulse waveforms were calculated by the MPG pulsimeter by using a custom algorithm [17].
The permanent magnet and the Hall device were placed inside an air bladder and made good contact with the biggest pulse spot in the radial artery. The weight of the MPG pulsimeter was ~80 g, including the battery. The electrical power consumed by this device during its operation was provided by a lithium battery and was under 1.7 W (500 mA, 3.4 V). With a fully charged battery, the device can keep the high/low blood pressure data for one day. Persons with normal BP were distinguished from those with high BP based on the pulse relation between systolic BP and regular arteriotony, which is able to divide by the shape of pulse wave [21-23].
Measurement of pulse wave
The diastole was defined as the starting point of a representative pulse wave and the systole was defined as the first zero point of the first differential wave. Here, the starting point is the notch point. The systolic peak (or augmentation point) was defined as the second or third zero point in the sixth differential of a pulse wave for normal blood pressure. The notch point was defined as the zero point of the third or fourth of the sixth differential of a pulse wave for high blood pressure [24-26]. Figure 1a shows a photograph of a mockup radial artery used for clinical testing and a wrist-wearable MPG pulsimeter that utilizes a Hall device element and a permanent magnet. The distance between the surface of a silicon rubber piece and the measuring part of the Hall device was 3 mm. Figure 1b shows a photograph of the real wrist-wearable MPG pulsimeter measuring a pulse wave, and schematic shows the cross-section with a detailed description of the device’s components. The pressure chamber between the part contacting the skin and the pulse-sensing parts was filled with air. An operating MPG pulsimeter continuously displayed processed pulse waves on a liquid crystal display (LCD) monitor.
After appropriate research volunteers for this study had been identified the inclusion and exclusion criteria, we established the process and method of pulse measurement. After the participants were selected for the normal BP group, the low BP group, and the hypertension group had been given a 5-minute break, the pulse waves were measured using the pulsimeter (3 minutes interval), which was followed by a 1- minute rest period and then another 3-minute pulse-wave acquisition.
Statistical analysis of clinical data
The number of participants for the clinical trial was not calculated because this research was an exploratory preliminary research to understand the algorithm for using the pulsimeter to measure the diastolic blood pressure (Pd) and the systolic blood pressure (Ps). For a normal distribution based on 5 people in each group, the parametric statistical method can be used. Thus, such a distribution could be used in our study with 15 participants (7 males and 8 females) in the group. Because measurements using a MPG may give rise to differences depending on sex, we divided the candidates by sex and then classified them into three groups: the normal BP group, the low BP group, and the hypertension group. Comparisons of the mean values of the variables age, height, weight, BMI(weight/(height)2; kg/m2), Ps, Pd, body temperature, and pulse wave were done for the normal BP group, the low BP group, and the hypertension group.
Results
A wrist-wearable cuffless MPG pulsimeter for clinical use is shown in Figures 2 and 3; this pulsimeter utilizes a Hall device for acquiring data. For solving the positioning problem according to the pressing intensity and the moving artifacts, and for acquiring precise pulse wave signals, which may depend on individual patient wrist characteristics, we developed a new cuffless wrist-wearable pulsimeter that features the comparison of seven Hall devices to one as shown in Figure 1.

Figure 2: A photograph of the cuffless wrist-wearable MPG pulsimeter showing the results of BP measurements and major parameters after processing the pulse wave. Schematic of a combination of seven modules, each with its Hall device and permanent magnet sensing one position on the radial artery.
Each module with its Hall device and permanent magnet senses one position on the radial artery. For measuring BP by using the pulse wave obtained from the radial artery based on the analysis of the non-pressurized pulse wave, which detects minute changes in the magnetic field of a permanent magnet, we used two phenomenological equations that are often used in Oriental diagnostic medical practice for estimating the BP.
Figure 3 shows the cuffless wrist-wearable MPG pulsimeter equipped with seven Hall sensors contacting on the radial artery. Any patient's condition (for example obesity, atrial fibrillation, circumference of thick and thin wrist) can be affected the reliability of the measurements. To maintain the reliability of the measurements according to the various circumferences of wrist, MPG pulsimeter was composed of the major parts such as soft rubber band, clip rail, and band clip for the length adjustment. By a preliminary and detailed investigation about wrist circumferences depending on males and females, we design to specify it and give insights about the necessity of a randomized trial, considering all the possible interferences for the various wrist features. The lengths of band of male and female are 150~220 mm and 150~290 mm with a width of above 26 mm. The length adjustment unit with a maximum of 70 mm is positioned at the end of band rail.

Figure 3: Photographs of the cuffless wrist-wearable MPG pulsimeter equipped with seven Hall sensors contacting on the radial artery. To maintain the reliability of the measurements according to the various circumferences of wrist, MPG pulsimeter was composed of the soft rubber band, the clip rail, and the band clip for length adjustment.
Figure 4 shows seven pulse waveforms measured for one clinical participant by using the seven measuring modules (each with its own Hall device and permanent magnet) of our wrist-wearable pulsimeter in Figure 2. The seven waveforms were measured simultaneously under steady pressure. After defining the noise filtering process, setting the region, and setting the maximal value and starting point for the acquisition of radial artery pulse waves, temporal signals for all measuring modules were plotted against the measurement time (seconds). The seven pulse waveforms were very similar.

Figure 4: Seven pulse waveforms measured for one clinical participant by the seven modules, each with a Hall device and permanent magnet, obtained using the wrist-wearable MPG pulsimeter under steady pressure.
Figure 4a shows a typical pulse wave form with major parameters such as Samp, Ramp, Namp, Stime, Rtime, Ntime, Ptime, As, and Ad that define the nine major parameters of the pulse wave [17,18].
The definitions of the nine parameters of the pulse wave in Figure 5a are given in the table in Figure 5b. In addition, the definitions of the nine pulse wave parameters in each area are provided in Figure 5a. The clinical data were used for calculating the average values of the pulse wave parameters over five consecutive pulse waves [12,17]. The parameters Samp, Namp, As, and Ad are especially important because they define, respectively, the systolic peak amplitude, the notch peak amplitude, the systolic area, and the diastolic area, which is separated from the systolic area by the notch amplitude Namp at time Ntime [11,17,21]. These average values were automatically saved as clinical data to an Excel file.

Figure 5: A typical pulse waveform and the definitions of major parameters for the typical pulse wave measured by a clip-type pulsimeter equipped with a magnetic sensing Hall device. Here, As and Ad define the systolic and diastolic areas, respectively, separated by the notch amplitude Namp at time Ntime.
Discussion
The main property of the pulse wave for calculating the estimated BP was extracted by applying the difference between the ratio of the systolic amplitude and the notch amplitude of the pulse wave. This must be performed for the systolic and diastolic areas. Because the air inside the air bladder containing the permanent magnet can be changed by relative pressure, the pressure applied to the sensing part of the MPG pulsimeter is maintained at the same value until the pulse waveform is displayed. For a more precise BP estimation, we divided the data from the clinical trial into five consecutive pulse waveforms.
Figure 6 shows three example waveforms that were used for estimating and deriving the intuitive equations for BP that appear below. We identified the main parameters necessary for deducing the equation for the estimated BP; these parameters were the systolic peak amplitude Samp, the notch peak amplitude Namp, the systolic area As, and the diastolic area Ad. Using these parameters, the following equations were deduced by analyzing Figure 4:
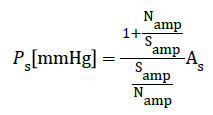 (1)
(1)
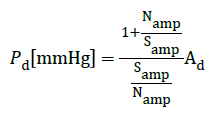 (2)
(2)

Figure 6: Three pulse waveforms obtained after applying filtering to 4.6-min-long recordings for three different clinical participants with: 1) normal BP (patient P-1); 2) low BP (patient P-2); and 3) hypertension (patient P-3).
Applying equations (1) and (2) to the measured data we estimated the systolic and diastolic blood pressure. The important quantities for this estimation were as follows: Ps, the systolic blood pressure; Pd, the diastolic blood pressure; Samp, the systole amplitude; Namp, the notch point amplitude; As, the systolic area; Ad, the diastolic area. Here, the blood pressure was measured in mmHg
Table 1 suggests the possibility to deduce the value of the CAP by measuring the pulse waveforms in a carotid artery. In addition, these results suggest that the MPG pulsimeter is a reliable medical device based on Oriental diagnostic methods and can be used for predicting atherosclerosis in the cardiac circulatory system.
| Patient No. | Parameter values of pulse wave | Estimated BP value | Measured BP value | ||||||||
|---|---|---|---|---|---|---|---|---|---|---|---|
| Samp | Stime | Namp | Ntime | Ptime | As | Ad | |||||
| Ps | Pd | Ps | Pd | ||||||||
| P-1 | 54.2 | 0.12 | 29.06 | 0.34 | 0.96 | 146 | 106 | 119 | 87 | 120 | 85 |
| P-2 | 34.6 | 0.1 | 17.8 | 0.3 | 0.77 | 141 | 91.8 | 110 | 71 | 110 | 70 |
| P-3 | 76.8 | 0.11 | 45.82 | 0.27 | 0.77 | 150 | 94 | 143 | 89 | 145 | 87 |
Table 1: Pulse wave parameter values and comparison of the estimated and measured BP values, for three representative patients participating in the clinical study
The pulse waveforms for a carotid artery in the neck and a radial artery in the hand wrist were individually measured using the developed MPG pulsimeter equipped with a permanent magnet and a Hall device.
The CAP was better correlated with cardiac vascular disease than with brachial arterial BP. Because the CAP is usually measured by inserting a catheter into a blood vessel, clinical data on central pulse measurement are not widely available.
However, the developed device enables to measure BP and CAP without using cuffs or invasive devices such as a catheter. Controlling the CAP is widely used together with BP treatment for reducing the incidence of cardiovascular diseases.
Table 2 shows the comparison between the measured value and the estimated value of BP from fifteen clinical patients. We compared the values of estimated BP from pulse wave data collected by MPG pulsimeter at the left wrist for 5 s with the measured values of BP obtained by an electron sphygmomanometer at the right upper arm. The standard deviation of the error in the values of estimated Ps and Pd obtained from equations (1) and (2) are calculated as 2.6 and 2.2. Since the value of the standard deviation was close to the limit on the International BP Standard, this device could be commercialized as a non-pressurization BP and arterial pulsimeter. If we are able to build up more data and thus develop a suitable equation that is able to decrease the error of systolic BP readings, our pulsimeter will be suitable for commercial applications.
| Classification | Systolic Blood Pressure (Ps) (mmHg) | Diastolic Blood Pressure (Pd) (mmHg) | ||||
|---|---|---|---|---|---|---|
| Clinical #1* | E2Value2* | M3 Value3* | Error4* | E Value | M Value | Error |
| 1 | 119.4 | 120 | 0.6 | 87 | 85 | -2 |
| 2 | 124.4 | 127 | 2.6 | 86.5 | 84 | -2.5 |
| 3 | 123.7 | 126 | 2.3 | 84.7 | 83 | -1.7 |
| 4 | 121.6 | 123 | 1.4 | 81.6 | 84 | 2.4 |
| 5 | 122.5 | 121 | -0.5 | 88.1 | 86 | -2.1 |
| 6 | 109.9 | 110 | -0.1 | 71.4 | 70 | -1.4 |
| 7 | 107.4 | 110 | 2.6 | 70.7 | 74 | 3.3 |
| 8 | 110.3 | 109 | -1.3 | 72.3 | 75 | 2.7 |
| 9 | 111.3 | 108 | -3.3 | 73.1 | 75 | 1.9 |
| 10 | 112.4 | 107 | -5.4 | 71.8 | 74 | 2.2 |
| 11 | 143.1 | 145 | 1.9 | 89.4 | 87 | -2.4 |
| 12 | 140.2 | 144 | 3.8 | 88.7 | 89 | -1.7 |
| 13 | 139.5 | 140 | 0.5 | 89.1 | 93 | 2.9 |
| 14 | 141 | 143 | 2 | 90.1 | 92 | 1.9 |
| 15 | 141.6 | 146 | 4.4 | 87.3 | 89 | 1.7 |
| S. D.5* | 2.6 | 2.2 | ||||
Table 2: Comparison of the measured value and the estimated value of BP applied to the clinical data. 1* Number; 2* Estimated; 3* Measured; 4* M value-E Value; 5* Standard Deviation
Several important issues need to be considered for successfully predicting cardiac diseases. These include 1) a change in the blood flow between the systole and diastole stages, 2) the pressure that makes the blood flow, and 3) a change in the blood vessel’s diameter. A catheter is usually inserted for detecting a change in the blood flow volume. This method is invasive and inaccurate, yielding especially significant errors in low-amplitude measurements (e.g., when measuring a change in the diameter of the coronary artery).
On the other hand, measuring BP is easier compared with measuring a change in the blood flow. However, successfully predicting cardiac disease and measuring microcirculatory pressure requires estimating the CAP. The microcirculatory pressure correlates with, and directly affects the cardiovascular circulation. In addition, the CAP is directly related to the damage to the cardiovascular system. The microcirculatory pressure and the CAP cannot be measured using the current technology. Rather than using the CAP, cardiac disease can be predicted based on the brachial blood pressure.
Rapid advances in medical technology prompted developing methods for non-invasive estimation of the CAP, and clinical trial for testing this state-of-the-art technology have been performed since 2010. Furthermore, the CAP has been adopted by the Western medical practitioners as a method of choice for blood pressure treatment since 2010 [3]. Yet a method for accurate measurement of the CAP is still lacking. Notwithstanding, both the International Hypertension Meeting and the International Academy of Cardiology have officially agreed to adopt the brachial blood pressure and the CAP in the treatment of cardiac disease. Furthermore, both the United States and Europe have agreed to adopt the brachial blood pressure and the CAP for the treatment of BP [2,27,28]. In 2010, Japan’s Hypertension Academy proposed using the brachial blood pressure and the CAP for managing BP, as described in the revised "Measuring blood pressure and clinical evaluation" guide book on treating hypertension [28].
To maintain the health of a human, reference values for cardiac output and total resistance of blood flow corresponding to this cardiac output were tabulated. Real cardiac output/reference values for cardiac output and real total resistance/criteria values of blood flow were set up to obtain a heart index and a total resistance index of the blood flow. Secondly, the BP was classified from the self-adjustment perspective by using a heart index and total resistance index of blood flow.
Conclusions
A wrist-wearable MPG pulsimeter equipped with a magnetic field-sensing semiconductor Hall device and a permanent magnet attached to silicon housing at the centre of the radial artery was developed for BP monitoring. This pulsimeter can acquire precise BP and pulse rate values by using a cuffless device containing a hardware and software system for measuring radial artery pulse waves transformed into voltage signals. The systolic and diastolic areas and the systolic and notch amplitudes of the radial artery pulse wave were used simultaneously for obtaining systolic and diastolic BP. The clinical tests for three human subjects (normal BP, hypotension, and hypertension) yielded precise BP similar to the BP values measured using conventional devices. Two estimated BP equations obtained using the cuffless arterial pulsimeter during 5 s show the analysis of the pulse wave measured during the testing of the arterial pulsimeter.
Based on the theoretical background, we developed a MPG pulsimeter for BP measurements, which enables measuring the brachial pressure and the CAP. Classifying BP in terms of hypertension, normal blood pressure, and hypotension is not efficient for preventing a cerebral vascular disease or a cardiovascular disease. Therefore, accurate self-adjustment is recognized as an essential and fundamental factor of any successful BP therapy. One of the goals of a successful BP therapy is to be able to simultaneously manage the brachial pressure and the CAP. Central aorta frequently develops not only arteriosclerosis but also atherosclerosis; thus, the CAP increases, worsening the outcome of artherosclerosis. Thus, the CAP is more closely related to the etiology of cardiac vascular diseases than the brachial arterial BP.
One important advantage of the proposed MPG pulsimeter is its portability, which allows using it as a wrist-wearable device for accurate BP measurement. This medical device can also yield data that are usually obtained by performing complicated procedures, such as for measuring the brachial pressure and the CAP, allowing to efficiently obtain precise BP. The developed MPG pulsimeter may be useful for developing a biomedical signal storage device for mobile U-health applications.
Acknowledgements
This study was supported by a grant from the Sangji University Research Program (2016).
References
- Danchin N, Benetos A, Lopez-Sublet M, Demicheli T, Safar M, et al. (2004) Aortic pulse pressure is related to the presence and extent of coronary artery disease in men undergoing diagnostic coronary angiography: a multicenter study. Am J Hypertens 17: 129-133.
- Roman MJ, Devereux RB, Kizer JR, Lee ET, Galloway JM, et al. (2007) Central pressure more strongly relates to vascular disease and outcome than does brachial pressure. Hypertension 50: 197-203.
- Vlachopoulos C, Aznaouridis K, Stefanadis C (2010) Prediction of cardiovascular events and all-cause mortality with arterial stiffness: a systematic review and meta-analysis. J Am Coll Cardiol 55: 1318-1327.
- Papamichael CM, Lekakis JP, Stamatelopoulos KS, Papaioannou TG (2000) Ankle-brachial index as a predictor of the extent of coronary atherosclerosis and cardiovascular events in patients with coronary artery disease. Am J Cardi 86: 615-618.
- Roman MJ, Devereux RB (2014) Association of central and peripheral blood pressures with intermediate cardiovascular phenotypes. Hypertension 63: 1148-1153.
- Fan F, Qi L, Jia J, Xu X, Liu Y, et al. (2016) Non-invasive central systolic blood pressure Is more strongly related to kidney function decline than peripheral systolic blood pressure in a Chinese community–based population. Hypertension 67: 1166-1172.
- Haider AW, Larson MG, Franklin SS, Levy D (2006) Systolic pressure, diastolic blood pressure, and pulse pressure as predictors of risk for congestive heart failure in the framingham heart study. Ann Inter Medi 138: 10-17.
- Shaltis PA, Reisner AT, Asada HH (2008) Cuffless blood pressure monitoring using hydrostatic pressure changes. IEEE Trans Biomed Eng 55: 1775-1777.
- Kim KH, SS Lee (2015) Peripheral blood flow velocity and peripheral pulse wave velocity measured using a clip-type pulsimeter equipped with a permanent magnet and a Hall device. J Magnetics 20: 47-51.
- Lee SS, Ahn MC, Ahn SH (2009) A new measurement method of a radial pulse wave using multiple Hall array devices. J Magnetics 14: 132-136.
- Lee SS, Son IH, Choi JG, Nam DH, Hong YS, et al. (2011) Estimated blood pressure algorithm for a wrist-wearable pulsimeter using Hall device. J Korean Phys Soc 58: 349-352.
- Lee SS, Choi JG, Son IH, Kim KH, Nam DH, et al. (2011) Fabrication and characterization of a wrist wearable cuffless pulsimeter by using the Hall effect device. J Magnetics 16: 449-452.
- Lee SS, Choi SD, Ahn MC, Choi YK, Kim KW, et al. (2014) Pulsimeter sensor using Hall device. USA Patent No. US 8,632,471 B2.
- Lee SS, Kim KW, Hwang DG, Kim SW, Kim HH (2010) Pulsimeter sensor using magnetic thin films. USA Patent No. US7,824,340 B2.
- O’Rourke MFP, Kelly RP, Avolio AP (1992) The Arterial Pulse. 1st ed. Lea & Febiger Philadelphia, PA, USA.
- Lee KH, Lee SS (2014) Pulse wave velocity measured by radial artery clip-type pulsimeter equipped with a Hall device and electrocardiogram. J Kor Mag Soc 23: 130-134.
- Lee NK, Rhee JK, Lee SS (2015) Analysis of vacuous pulse and replete pulse by using a clip-type pulsimeter equipped with a Hall sensor. J Acu Meri Stud 5: 83-93.
- Hong YS, Rhee JK, Kim HK, Son IH, Yoon WS, et al. (2014) Fuzzy simulation of a multi-electronic acupuncture system and clip-type pulsimeter equipped with a magnetic sensing Hall device. J Magnetics 19: 255-260.
- Rhee JK, Lee SS (2013) Analysis of both hands’ two pulse waveforms using a clip-type pulsimeter equipped with magnetic sensing Hall device. J Magnetics 18: 183-187.
- Nam DH, Lee WB, Hong YS, Lee SS (2013) Measurement of spatial pulse wave velocity by using clip-type pulsimeter equipped with Hall sensor and photoplethysmography. Sensors 13: 4714-4723.
- Son IH, Kim KH, Choi JG, Nam DH, Lee SS (2011) Measurement and analysis of pulse wave using a clamping pulsimeter equipped with Hall effect device. IEEE Trans Mag 47: 3063-3065.
- Lee SS, Nam DH, Hong YS, Lee WB, Son IH, et al. (2011) Measurement of blood pressure using an arterial pulsimeter equipped with a Hall device. Sensors 11: 1784-1793.
- Kim SW, Choi YG, Lee HS, Park DH, Hwang DG, et al. (2006) Improvement of pulse diagnostic apparatus with array sensor of magnetic tunneling junctions. J Appl Phys 99: R908-R910.
- Choi SD, Kim SW, Kim GW, Ahn MC, Kim MS, et al. (2007) Development of spatial pulse diagnostic apparatus with magnetic sensor array. J Magn Magn Maters 310: e983-e985.
- Lee SS, Kim GW, Ahn MC, Park YS, Choi JG, et al. (2007) Embodiment of spatially arterial pulse diagnostic apparatus using array multiple Hall devices. J Biomed Eng Res 28: 721-726.
- Fronek A, Barnes RW, Sumner DS (1989) Non-invasive diagnosis in vascular disease, Appleton Davies Pasadena, CA, USA.
- Asmar R, Benetos A, London G, Hugue C, Weiss Y, et al. (1995) Aortic distensibility in normotensive, untreated and treated hypertensive patients. Blood Press 4: 48-54.
- The Japanese Society of Hypertension Guidelines for the Management of Hypertension (2014) Hypertens Res 37: 253-392.

Open Access Journals
- Aquaculture & Veterinary Science
- Chemistry & Chemical Sciences
- Clinical Sciences
- Engineering
- General Science
- Genetics & Molecular Biology
- Health Care & Nursing
- Immunology & Microbiology
- Materials Science
- Mathematics & Physics
- Medical Sciences
- Neurology & Psychiatry
- Oncology & Cancer Science
- Pharmaceutical Sciences